Between 2022 and 2023, Australia recorded the steepest drop in adjusted Share (9.4%) among the top 20 countries in the Nature Index, signalling trouble for its research sector. For the first time since 2018, Australia dropped from 10th place to 12th in 2023, overtaken by India and Italy.
These charts highlight the strongest institutional players in a sector that needs to regain its footing in an increasingly competitive global research landscape.
World standing
Australia’s decline in adjusted Share between 2015 and 2023 in the natural sciences stands out among its competitors in the Nature Index. Although all countries in the chart below recorded a decline during this period (in large part owing to China’s rapid increase in Share), Australia’s drop was the most dramatic, falling by 360 over the period. Spain had the second-highest drop, at 294.
Leading lights
The Share of the ten leading institutions in Australia is shown by subject area. The University of Queensland in Brisbane, and the University of New South Wales in Sydney, lead two subjects each, while the University of Melbourne leads in health sciences.
Slow progress
The 2022 and 2023 adjusted Share is shown for the institutions that recorded the largest change in adjusted Share for the period. The changes are relatively modest, which reflects the country’s overall decline in Share in the Nature Index as it struggles to compete with the likes of China and India, which are among a small handful of top-20 countries to achieve positive growth in adjusted Share from 2022 to 2023.
Cross-border collaborations
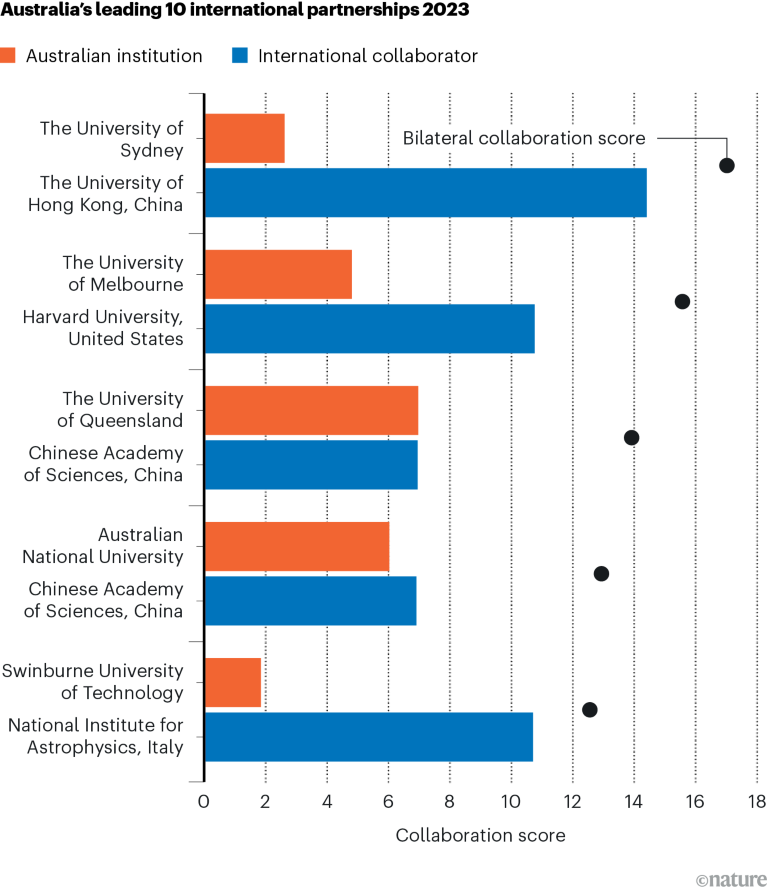
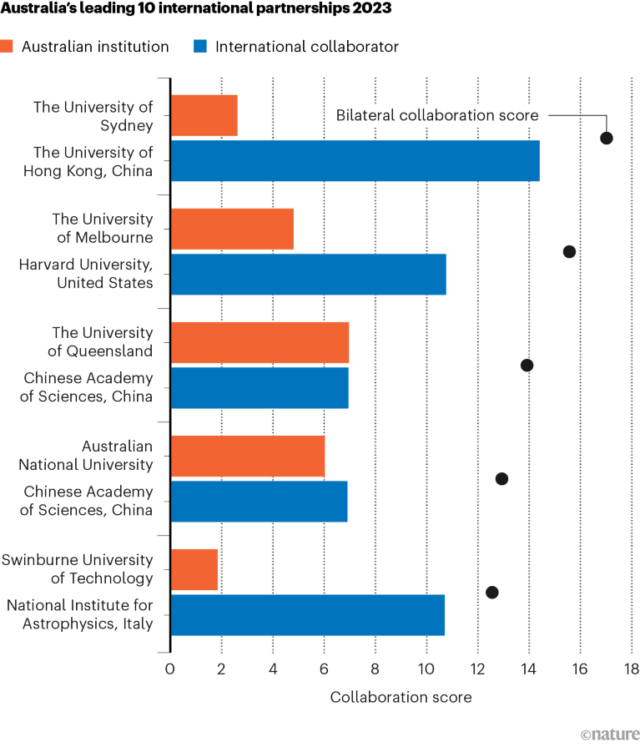
Australia’s two strongest collaborative partners in the Nature Index in 2023 were the United States and China. Of the ten leading international collaborations for Australian institutions — five of which are shown below — six are with US and Chinese institutions. Among the leading countries in the database, Australia has one of the highest percentages of international articles, at 86.8%. For the United States and China, this figure is 54.8% and 36.5%, respectively.

Source: Nature Index
Domestic ties
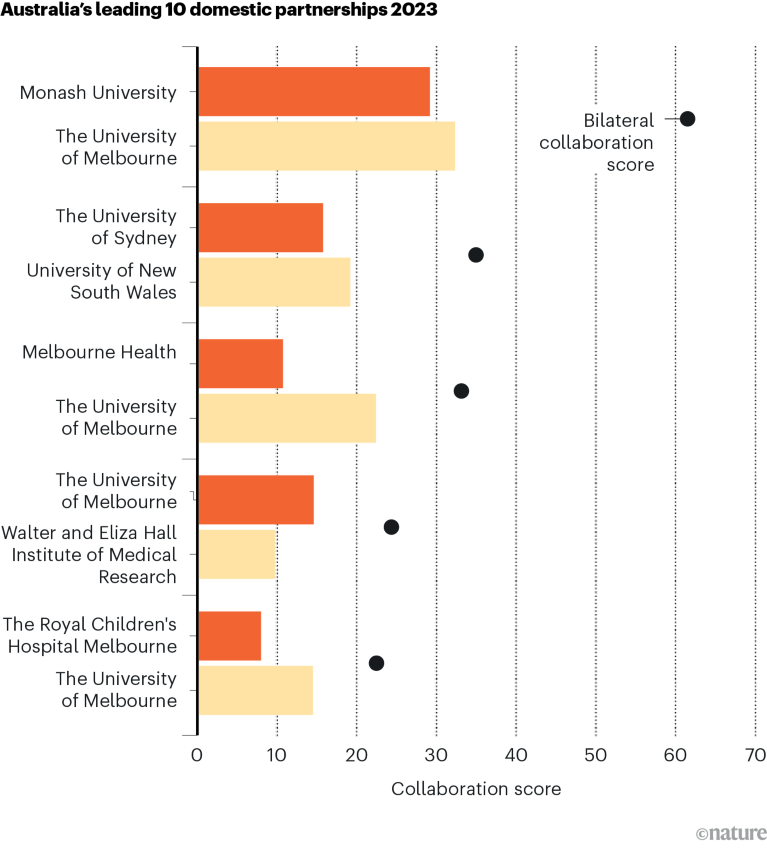
The University of Melbourne leads the top collaborations between Australian institutions in 2023, forming four out of the top five partnerships. Each pair of collaborating institutions is based in the same city, highlighting the importance of geographical proximity in research.

Source: Nature Index
Change in output
The weakened state of Australian research is not just evident in Nature Index data. A look at Australian Research Council (ARC)-funded publications suggests the country’s output has declined steeply since 2020 and 2021, two years when COVID-related research helped to drive productivity. In 2023, the total number of ARC-funded publications was 15,783, according to the Nature Navigator platform, which uses data from Dimensions by Digital Science. This is the lowest number of publications since 2016, when it was 15,382.
Another stark change is the increase in open access, or free to read, papers over this time. In 2015, 65% of ARC-funded publications were pay-to-read, according to Navigator, and 28% were free to read (the status of the remaining per cent is unknown). These numbers stayed relatively consistent until 2022, at the height of the pandemic, when free-to-read papers jumped to 47%. By 2023, 60% of papers were free to read and 29% were pay-to-read, and in 2024, which is an incomplete year, free-to-read publications account for 68% of ARC-funded output so far.
The biggest topic areas in ARC-funded research between 2015 and 2024 are computational models and algorithms, and clinical studies and public health, accounting for 103,840 and 101,586 publications, respectively, of the total 212,979 for the period, according to Navigator (papers can be related to one or more topic and subtopic). Within computational models and algorithms, 101,866 publications were related to ‘mathematical modelling and numerical methods’, a sub-topic within the field. Within clinical studies and public health, 77,845 publications were related to the ‘clinical interventions and health services research’ subtopic, according to Navigator.
This article is part of Nature Index 2024 Australia, an editorially independent supplement. Advertisers have no influence over the content. For more information about Nature Index, see the homepage.


